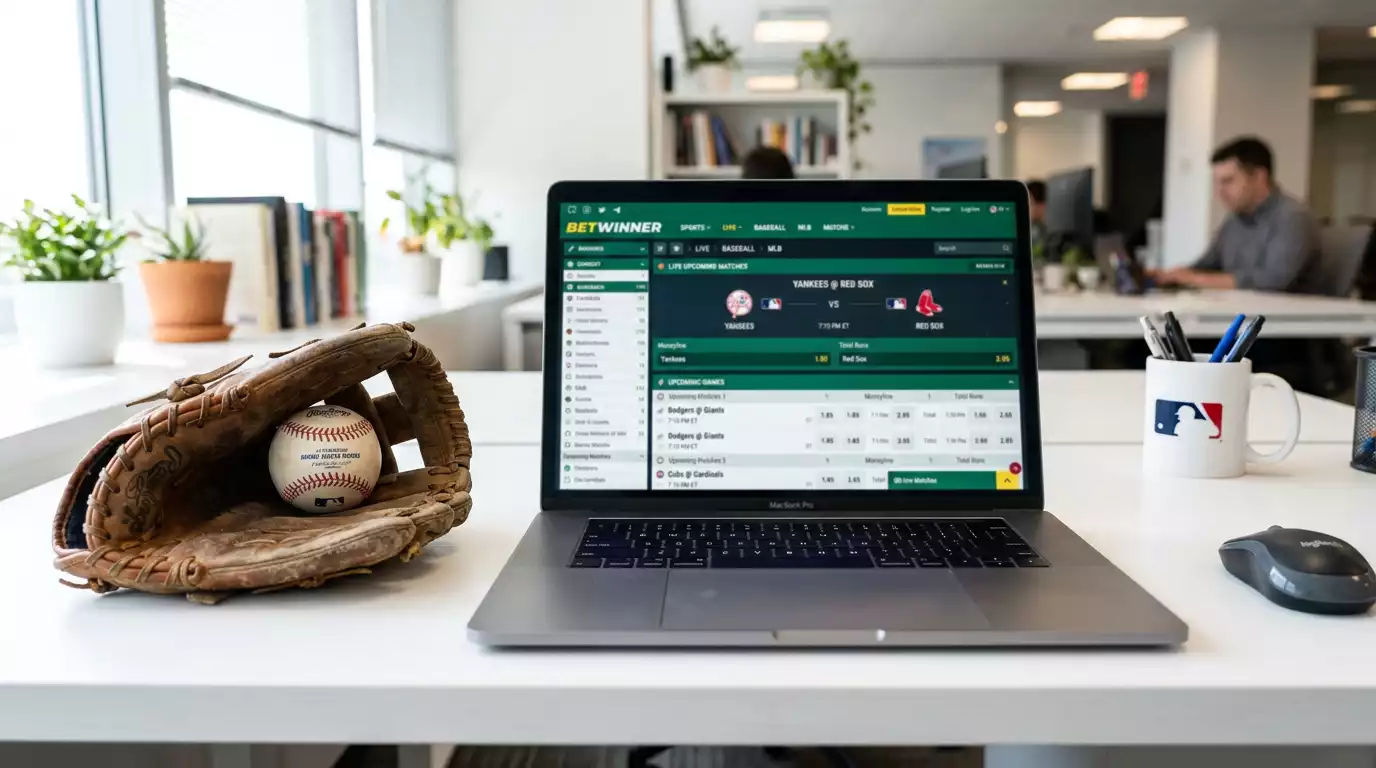
MLB Moneyline Betting: Securing Top Underdog Odds for UK Punters
 Available in US
I placed my first MLB moneyline bet on a road underdog that every preview had written off. The starting pitcher had a deceptively high ERA inflated by one disastrous outing, and the price reflected the market’s overreaction to that single start. The team won by three runs. That experience – more than any spreadsheet or model – taught me the core lesson of moneyline betting in baseball: this sport is more unpredictable on a game-to-game basis than almost any other major league, and that unpredictability is where your edge lives.
Evaluating Why Moneyline Markets Dominate MLB Wagering
Baseball does not have a point spread the way football or basketball does – at least not as its primary market. The moneyline, where you simply pick the winner, is the foundational MLB bet. Every other market – run line, totals, props – builds outward from the moneyline as the anchor. The reason is structural: with 2,430 regular-season games generating daily opportunities across six months, and with outcomes driven heavily by one or two individual performances (starting pitchers), the moneyline captures the essence of what you are analysing better than any spread can.
The volume of games matters enormously. In the NFL, you get 16 or 17 games per team per season; a bad week represents roughly 6% of the entire sample. In MLB, a bad week is three or four losses out of 162 games – noise, not signal. That larger sample size means the market has more data to work with, which generally produces tighter lines, but it also means the market has more chances to misprice individual matchups because no analyst – human or algorithmic, can give equal attention to every single game on a twelve-match Tuesday slate.
Underdogs Win More Often in Baseball Than You Think
Here is the number that changed how I approach MLB wagering forever: historically, MLB underdogs win somewhere around 42-44% of all games. Compare that to the NFL, where underdogs win closer to 35% of the time. Baseball’s compressed talent gap means the worst team in the league still beats the best team roughly three or four times out of ten when they meet head-to-head. That frequency is high enough to build a profitable long-term strategy around, provided you are disciplined about the prices you accept.
The reason for this compressed win distribution comes down to the sport’s mechanics. A single starting pitcher, no matter how dominant, faces the opposing lineup three or four times through the order, and by the third time through, hitters have seen his pitch sequences and adjust. Bullpen usage introduces further variance. A defensive error at a critical moment can flip a game regardless of the talent gap between the two rosters. These factors combine to produce an outcome distribution where favourites are less reliable than the casual bettor assumes.
That assumption gap is your opportunity. When the public loads up on a heavy favourite, say, a team priced at 1.40 decimal, the bookmaker may shade the line further toward the favourite to balance liability, which inflates the underdog’s price beyond what the true probability warrants. Systematic underdog betting in MLB will not win every week, but over the course of a 162-game season, even a small edge compounds into meaningful profit.
Spotting Mispriced Favourites
Last season I tracked a stretch where a particular NL West team opened as a favourite in 18 consecutive home games. They won 11 and lost 7, a perfectly normal result given their talent level. But the market priced them as if they would win 14 or 15 of those games, which meant the underdogs visiting that ballpark were consistently overpriced. I backed seven of those visitors and went 4-3, with an average price of 2.65 decimal. The returns were not dramatic on any single bet, but the cumulative ROI across those seven wagers was north of 20%.
Identifying mispriced favourites starts with the starting pitcher. If a team’s ace is on the mound, the favourite price is often justified. But on days when the fourth or fifth starter pitches, the team name carries more weight in the market’s mind than the actual pitching matchup warrants. The average hold across US sportsbooks ran at 10.15% last year, according to industry data, which tells you that significant margin is built into every line. When the bookmaker overestimates a favourite’s probability on top of that built-in margin, the underdog’s true edge can be substantial.
Look for convergence of these signals: a favourite starting their weakest pitcher, facing an underdog whose starter has strong recent peripherals (low FIP, high strikeout rate), in a ballpark that suppresses offence. When those factors align, the moneyline underdog is often the sharpest bet on the board. Cross-referencing this kind of analysis with run-line pricing mechanics helps you decide whether to take the moneyline straight or explore a +1.5 run line for added security at a lower price.
Reading Moneyline Value in Decimal Odds
Working in decimal makes value assessment mechanical rather than intuitive, which is exactly what you want. If your model says a team has a 45% chance of winning, the fair decimal price is 1 divided by 0.45, or 2.22. Any price above 2.22 represents positive expected value; anything below represents a bad bet regardless of how much you like the team.
The discipline here is resisting the urge to bet on teams rather than prices. I have a rule that I never place a moneyline wager unless the available decimal odds exceed my model’s fair price by at least 5%. That buffer accounts for model uncertainty and ensures I am not chasing marginal edges that evaporate with a single bad bounce. In a sport with 2,430 games per season, patience is not just a virtue, it is a mathematical necessity. There will always be another opportunity tomorrow.
One practical tip: most UK sportsbooks default to decimal display, which makes this comparison straightforward. If you are consuming analysis from US sources that use American odds, convert to decimal before comparing against your model’s output. Mixing formats mid-analysis is how mistakes happen, and in moneyline betting, where margins are thin, a single misread price can wipe out a week’s worth of careful handicapping.
What is the average win rate for MLB underdogs in a full season?
MLB underdogs historically win approximately 42-44% of all regular-season games. This is significantly higher than underdog win rates in sports like American football, where the talent gap between teams is wider. The compressed win distribution in baseball is driven by pitcher variance, bullpen volatility, and the high frequency of games over the 162-game schedule.
Should I always take the moneyline over the run line?
Not necessarily. The moneyline is the cleaner bet when you believe a team will win but the margin of victory is uncertain. The run line at +1.5 offers a lower payout but adds insurance against a one-run loss, while the -1.5 run line pays more but requires a two-run victory. Your choice should depend on the specific matchup, the pitching quality, and whether the available odds on each market represent value relative to your probability estimate.
Written by the editors at Online Betting mlb.