MLB Weather Betting: Park Factors, Wind, and Altitude
 Available in US
The bet that made me a weather convert was a Rockies-Padres over at Coors Field in late June. Temperatures were hovering around 32 degrees Celsius, wind was blowing out to centre at fifteen miles per hour, and the posted total sat at 11.5. My model said 13. The game finished 14-9. That evening crystallised something I had been circling around for months: weather is not a footnote in MLB handicapping – it is a primary variable, and ignoring it means ignoring one of the few edges that the market consistently underweights.
Every MLB team plays 162 regular-season games across six months, and those games unfold in stadiums stretching from the humid Gulf Coast to the thin air of the Rocky Mountains. The atmospheric conditions at first pitch directly affect how far a batted ball carries, how well a pitcher’s breaking ball bites, and how quickly a game’s scoring environment diverges from the pre-match projection. If you are betting totals or run lines without checking the weather, you are operating with incomplete information – and in a sport with 2,430 games per season, incomplete information compounds into real money left on the table.
Wind Direction and Speed: The Biggest Variable
Wind blowing out to centre field at Wrigley once turned a routine fly ball into a two-run home run that flipped the game – and my total – in the seventh inning. I was on the under. I learned. Wind direction relative to the batter’s perspective is the single most impactful weather variable for MLB totals. Out-blowing wind carries fly balls further, inflating home run rates and pushing scoring upward. In-blowing wind suppresses offence by knocking down what would otherwise be deep drives.
The magnitude matters as much as the direction. At ten miles per hour blowing out, the effect is modest – perhaps one additional run per game on average above the baseline. At twenty miles per hour, you are looking at a meaningful shift, enough to move a total by a full run or more. Crosswinds have a smaller effect on overall scoring but introduce unpredictability for fielders tracking fly balls, which can lead to errors that do not show up in any pre-match model.
Wrigley Field in Chicago is the most famous example because it is an open-air stadium where wind off Lake Michigan changes direction frequently. But the principle applies everywhere. Even stadiums with partial enclosures can funnel wind through openings in ways that affect ball flight along specific trajectories. The data I track shows that games at Wrigley with sustained outbound winds above twelve miles per hour see roughly 1.3 more runs per game than the seasonal average, a number large enough to consistently create value on over/under totals when the market does not fully adjust.
Temperature, Altitude, and Ball Flight
Warm air is thinner than cold air. Thinner air means less drag on a batted ball, which means it carries further. The physics are straightforward, and the betting implications follow directly. Games played in July and August at outdoor stadiums in warm climates tend to produce more runs than April games at the same venues, not because the hitters are better but because the air is different.
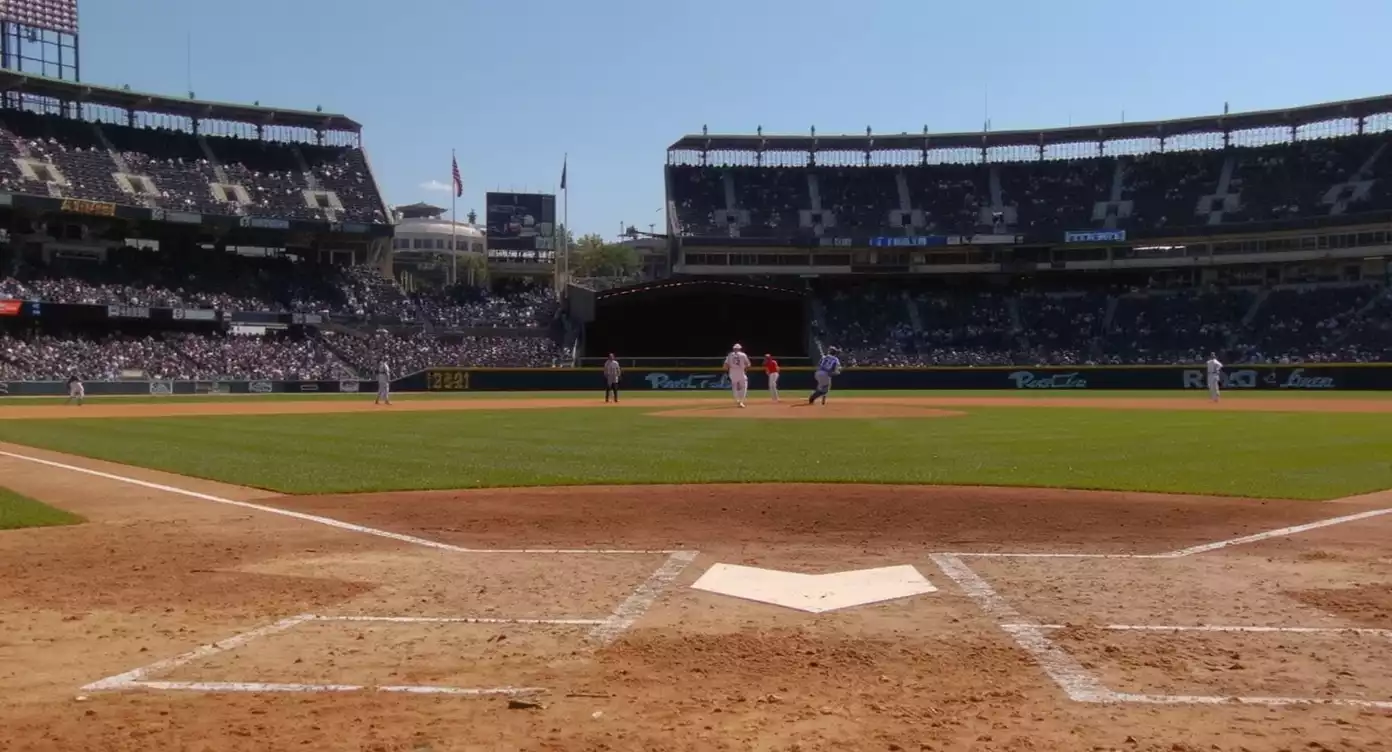
Then there is altitude. Coors Field in Denver sits at 1,580 metres above sea level, where the air density is roughly 17% lower than at sea level. This is the most extreme park factor in professional baseball, and it shows up in every statistical measure. The average game time across MLB settled at 2 hours and 38 minutes in the 2025 season – the third consecutive year under 2:40 – but Coors games often ran longer because higher scoring means more pitching changes, more plate appearances, and more time between plays. The total at Coors is set two to three runs higher than the same matchup would receive at a neutral venue, but even that adjustment sometimes falls short during peak summer conditions.
Humidity adds a layer of nuance. Contrary to the common assumption that humid air is “heavy,” humid air is actually lighter than dry air because water vapour molecules are lighter than the nitrogen and oxygen molecules they displace. So high humidity, like high temperature, reduces air resistance and helps batted balls travel further. The effect is smaller than wind or altitude, but in a sport where margins are thin, it is one more data point that sharpens your analysis.
Using Park Factors to Adjust Totals and Run Lines
Park factors quantify how much each stadium inflates or suppresses offence relative to a neutral environment. A park factor of 110 means a stadium produces 10% more runs than average; 90 means 10% fewer. These numbers are readily available from public baseball databases, and they should be the starting point for any totals or run-line bet.
The mistake most bettors make is treating park factors as static. They are season-long averages that smooth out the day-to-day variation caused by weather. A stadium with a park factor of 105 might play at 115 on a hot day with wind blowing out and at 95 on a cold, damp evening with wind blowing in. The season-long number is a baseline, not a forecast. Layering real-time weather data on top of the park factor gives you a dynamic estimate of the scoring environment for that specific game – and that dynamic estimate is almost always sharper than the static number the bookmaker uses to set the opening line.
My process is simple. I pull the day’s weather forecast for each ballpark about two hours before first pitch. I compare the wind direction and speed, temperature, and humidity to the park’s seasonal averages. If the conditions are significantly more run-friendly than average, I look at the total to see whether the market has already adjusted. Often, the adjustment is partial, the total might move up half a run when the weather suggests a full run of additional scoring. That gap is where the value lives.
Retractable Roofs and Controlled Environments
Seven MLB stadiums have retractable roofs, and several more are fully enclosed. When the roof is closed, weather becomes irrelevant, the temperature is regulated, there is no wind, and humidity is controlled by the building’s systems. This neutralises the entire weather-analysis advantage, which is useful information in itself. If you have built an edge around weather-based totals adjustments, games played under a closed roof are not your market. Concentrate your attention elsewhere.
When the roof is open, retractable-roof stadiums behave like any other outdoor venue. The decision to open or close the roof is typically made several hours before first pitch, and some sportsbooks adjust their lines after the announcement. If you are tracking roof status and the bookmaker has not yet reacted to a roof-open decision on a day with heavy winds, you have a window of opportunity, narrow, but real.
Domed stadiums like Tropicana Field eliminate weather variance entirely. Games there produce scoring distributions that are remarkably consistent across the season, which makes them better suited for model-based approaches that rely on pitcher matchups and lineup data without the noise introduced by atmospheric conditions. Knowing where weather matters and where it does not is itself a form of edge, it tells you where to allocate your analytical effort on any given day of the schedule.
How much does Coors Field altitude affect MLB totals lines?
Coors Field sits at 1,580 metres above sea level, reducing air density by roughly 17% compared to sea level stadiums. This causes batted balls to travel significantly further, producing higher scoring games. Bookmakers typically set totals at Coors two to three runs higher than the same matchup would receive at a neutral venue. The adjustment is built into the posted line, but extreme weather conditions on a given day can push actual scoring beyond even the elevated total.
Where can I check real-time weather at MLB stadiums before placing a bet?
General weather services provide forecasts for stadium locations. For wind direction and speed, the most impactful variable, look for hourly forecasts specific to the city rather than regional summaries. Some baseball analytics sites also provide pre-game weather reports tailored to betting, including wind direction relative to the batter and temperature at first pitch. Check conditions roughly two hours before game time for the most accurate read.
Written by the editors at Online Betting mlb.